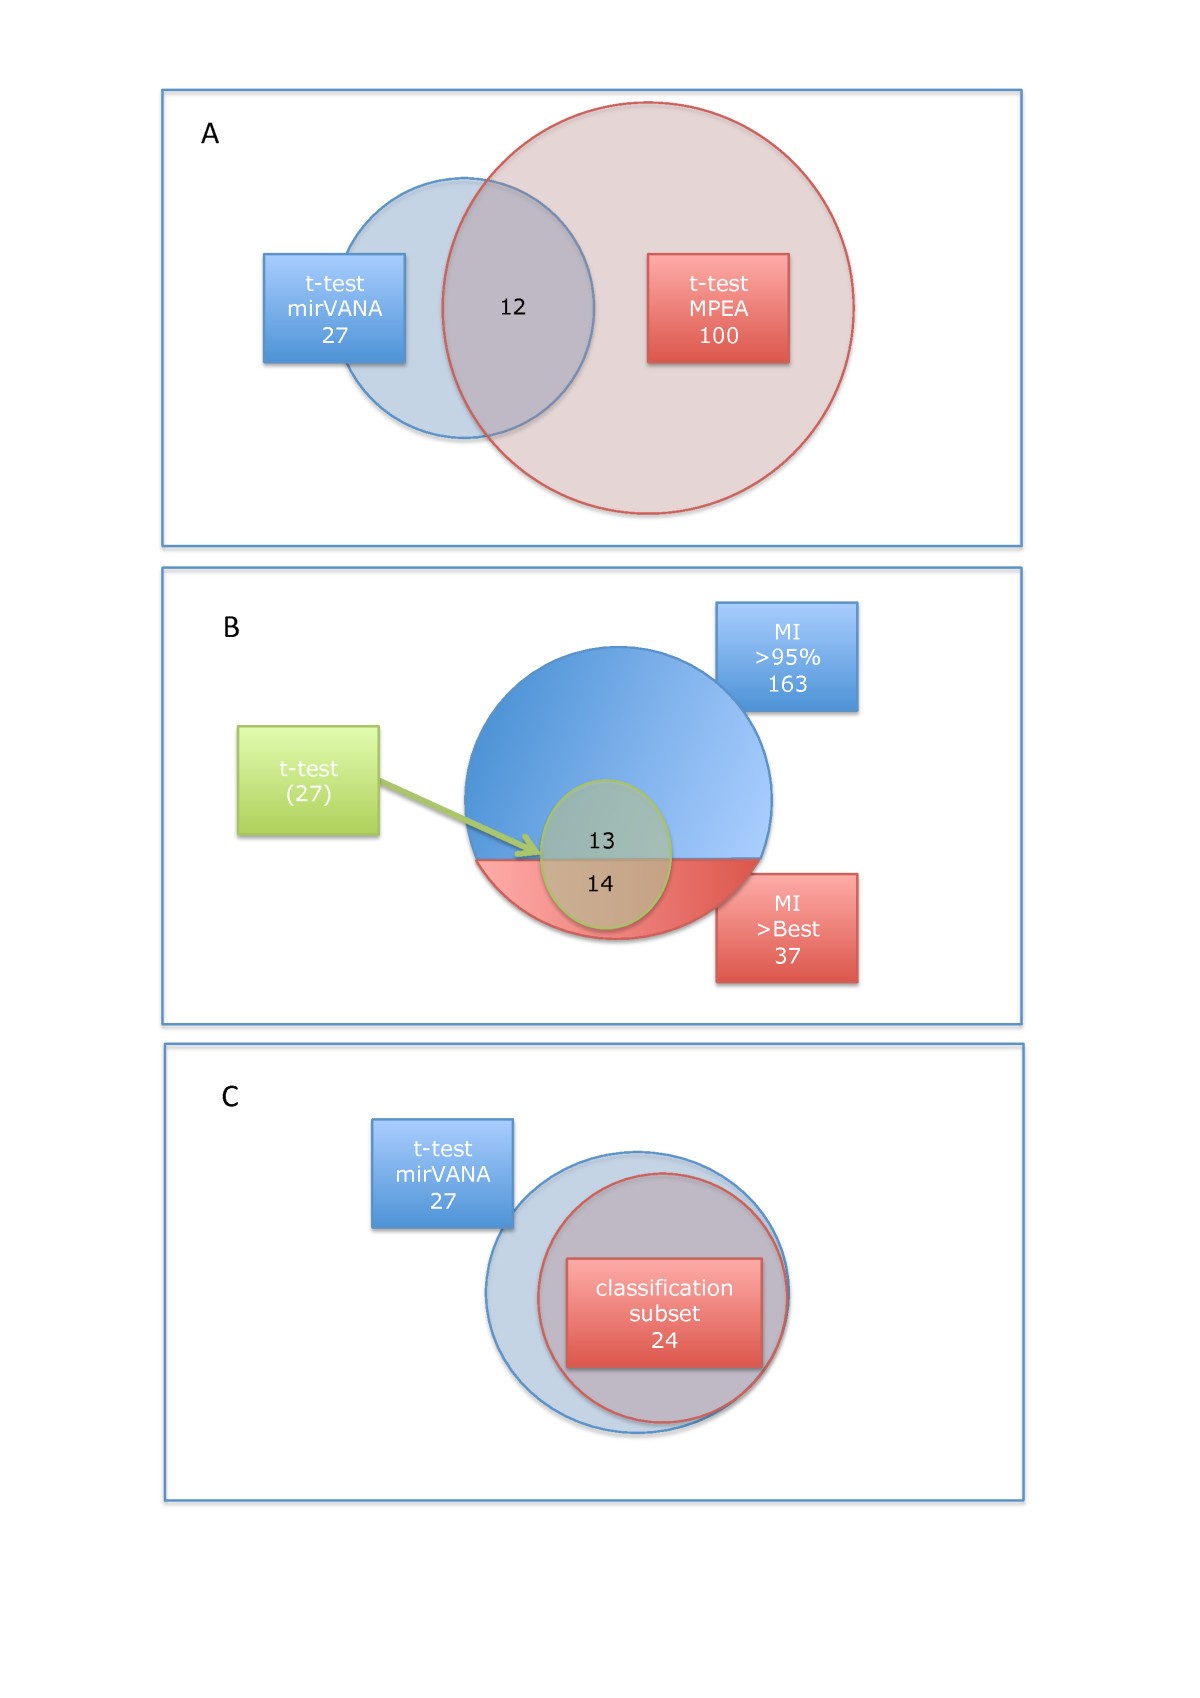
Figure 5

Venn diagrams for different analyses. A) Venn diagram of the t-test mirVANA and MPEA labeling. B) Venn diagram of the t-test and the Mutual Information. The right circle shows significant MI miRNAs, separated in the miRNAs that are higher than the highest permutation test and the miRNAs higher than 95% of all 1000 permutation tests. The 27 miRNAs are all included in these miRNAs, indicated by the green circle. C) Venn diagram of t-test miRNAs and miRNAs used in the best classification subset. The 24 miRNAs used for classification are all contained in the set of 27 most significant mRNAs